

For most Pakistani channels, two numbers matter more than everything else in YouTube Studio. Those are Click-Through Rate and Average View Duration. Together they decide how widely the algorithm distributes a video. Total subscriber count and raw views stay mostly vanity numbers. They rarely drive smart decisions on their own. This guide keeps YouTube Analytics for Pakistani channels simple and practical. You will learn which numbers deserve real attention, and which to ignore. New creators can treat it as a starting point for YouTube analytics for beginners Pakistan can actually use. For ranking tactics instead of metric reading, see our guide on YouTube SEO in Pakistan.
Ready to Grow Your YouTube Channel?
Let Delenzo Studio handle your YouTube channel with expert SEO, content planning, video publishing, thumbnail design, analytics, and growth strategies. Focus on creating content while we help you build a stronger, faster growing channel.
Get Free ConsultationThe Only 2 YouTube Metrics That Actually Matter in Pakistan
Two metrics predict future reach better than any others. Click-Through Rate shows the algorithm your thumbnail earns clicks. Average View Duration proves your content holds attention. Strong scores on both signal a video worth recommending. These two numbers form the real backbone of YouTube Analytics for Pakistani channels should track first.
Click-Through Rate (CTR): Why It’s the Most Important Metric
Click-through rate measures the share of impressions that turn into clicks. A higher CTR tells YouTube your title and thumbnail work well. The algorithm then serves the video to more people. A weak CTR quietly limits how far a good video travels.
A realistic YouTube CTR benchmark Pakistan creators can target sits around 3 to 6 percent for entertainment. Educational videos often push toward 4 to 8 percent. High-intent tutorials can climb into double digits. New channels usually start lower, and that is normal.
Most Pakistani viewers watch on mobile data, often on smaller screens. So your thumbnail must stay bold and readable at a glance. A few practical fixes lift CTR fast:
- Use one clear focal point, not a busy collage.
- Keep on-screen text under four words.
- Test a face with strong emotion against a plain object shot.
- Match the thumbnail promise to the actual video content.
Picture a Lahore podcast channel with sharp guests but flat views. The audio and editing are solid, yet impressions barely convert. Nine times out of ten, the thumbnail is the leak. Swapping a dull wide studio shot for a close, expressive face often doubles CTR. So treat every thumbnail as a small test, not a final choice. Change one element, wait a few days, then compare the numbers.
Average View Duration (AVD) and Retention: Why It’s the Second Most Important Metric
The average view duration YouTube meaning is straightforward. It shows how much of your video people actually watch. Longer watch time tells the algorithm your content delivers value. That signal often matters more than total view count.
Use these rough benchmarks to judge any upload:
- Above 40 percent watched counts as strong.
- Above 50 percent counts as excellent.
- Under 30 percent points to a hook problem.
The retention curve shows the exact second viewers leave. A sharp early drop usually means a slow or messy opening. Weak audio and shaky footage push people away just as fast. That is where YouTube retention production quality becomes a genuine factor. Clear sound and steady visuals keep viewers watching longer.
Your first 30 seconds decide most of the outcome. A long intro or slow music loses people before the value lands. Open with the payoff, then explain how you got there. Also watch for repeated mid-video dips. A drop at the same point across videos signals a fixable habit.
The Supporting Cast: Analytics That Guide Smart Decisions (After CTR & AVD)
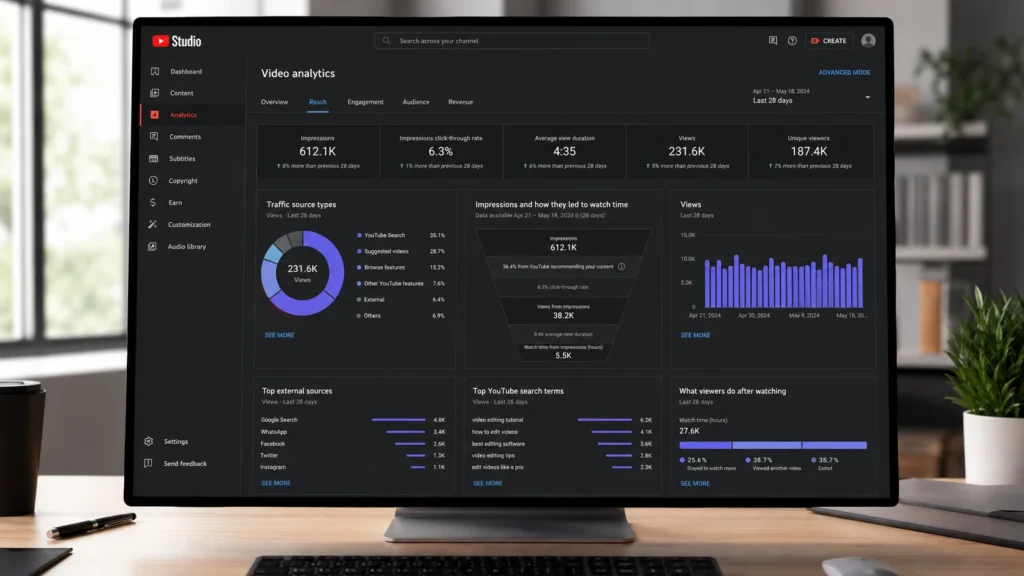
These next metrics guide good choices, though they sit below CTR and AVD. Read them second, never first. They explain how a video behaves once discovery already works. Treat them as supporting evidence, not headline numbers.
Traffic Source Types
Traffic sources show where your views come from. A healthy mix leans on YouTube search and suggested videos. That means the algorithm actively recommends your channel on its own. Read each source as a signal:
- Search and suggested: viewers find you through YouTube itself, the strongest sign.
- Browse and home feed: YouTube trusts your channel with its own audience.
- WhatsApp and social shares: useful for early momentum, weak as a long-term base.
Many Pakistani creators start by sharing links in WhatsApp groups. That is fine early on. Over time, you want a bigger share from search and suggestion. So track the direction of each source, not just today’s split.
Subscriber Conversion Rate vs. Raw Subscriber Count
Raw subscriber count is a lagging vanity number. Subscribers gained per video reveal far more. It shows which uploads turn casual viewers into a real audience.
A healthy target sits between 0.5 and 2 percent of unique viewers. Divide subscribers gained by unique viewers on that video. This sits at the heart of vanity metrics YouTube Pakistan creators over-track. Try a quick example. A video with 10,000 viewers and 120 new subscribers converts at 1.2 percent. That beats one with 50,000 views and only 100 subscribers. So study your best converters and repeat them.
Returning Viewers vs. New Viewers
Returning viewers measure loyalty, not reach. A healthy channel keeps around 20 to 40 percent returning. A low figure hints at weak consistency or scattered formats.
You raise this number with steady, predictable value. Keep an upload rhythm your audience can expect. Hold a familiar format and stay in one clear topic lane. Consistency turns first-time viewers into regulars. Loyal viewers also help during slow algorithm weeks. They watch early and signal value fast, which helps new videos reach fresh people. Treat your regulars as the base, then grow on top.
RPM vs. CPM: What Pakistani Creators Should Actually Expect
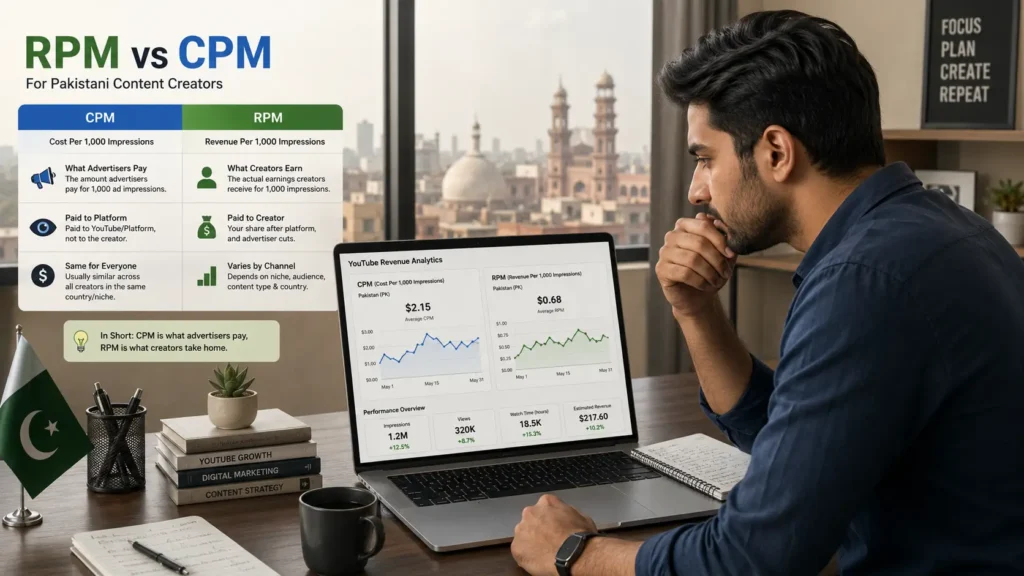
Money metrics confuse many new creators. CPM and RPM sound alike but mean different things. Understanding both sets realistic income expectations for a Pakistani audience. Mixing them up leads to disappointment and bad comparisons.
The Difference Between RPM and CPM
CPM and RPM answer two different questions. This table shows the split at a glance:
| Matric | CPM | RPM |
| What it measures | What advertisers pay per 1,000 ad impressions | Your earnings per 1,000 total views |
| Who sets it | The advertising market | Your own mix of views and income |
| Level | Higher | Always lower |
| Use it for | Reading ad demand | Judging your real income |
RPM sits lower for good reasons. YouTube takes its cut first, and not every view shows an ad. RPM also counts non-monetized views in the average. It blends several income streams into one figure. That includes ad revenue, YouTube Premium views, channel memberships, and Super Chat. So a channel with active members may earn more per view than ads alone suggest.
Why Pakistani-Audience RPM Runs Lower Than US/UK Benchmarks
The YouTube RPM Pakistan creators earn usually sits below US or UK figures. Advertiser demand and ad rates vary sharply by audience geography. Most global benchmarks assume a Western-majority audience, so they miss local reality. The gap in YouTube RPM Pakistan vs USA comparisons is normal, not failure.
So judge your RPM against regional expectations, not foreign numbers. For a realistic read, do this:
- Compare your RPM to your own past months, not to other creators.
- Pull live figures from your Studio Revenue tab, since rates shift often.
- Plan bigger uploads around Ramadan, Eid, and year-end, when ad demand rises.
Reading Audience Geography for Urdu and Roman Urdu Content
Urdu and Roman Urdu channels rarely stay purely domestic. Your Urdu YouTube audience geography analytics often show viewers well beyond Pakistan. India, Bangladesh, and the diaspora in the UK, US, and Gulf appear often.
A large Indian share may reward neutral, widely understood Urdu. Diaspora views can lift blended RPM, while heavy India or Bangladesh traffic may lower it. So read your geography report before setting revenue targets. Domestic viewers want local prices and brands. The diaspora often wants context they cannot get at home. Check the geography tab monthly and adjust your framing.
A Simple Weekly Analytics Routine for Pakistani Creators
A short weekly check keeps you focused without data overload. You do not need all 14 available metrics at once. Knowing what YouTube metrics actually matter 2026 saves hours of confused scrolling. This routine for YouTube Analytics for Pakistani channels stays quick and repeatable.
Work through it in this priority order:
- Check CTR and AVD on your last two or three uploads first.
- Open the retention curve on any weak video next.
- Find the exact drop-off point and note the timestamp.
- Review your traffic source mix after that.
- Check subscriber conversion on recent videos last.
| Metric | What It Means | Healthy Benchmark | Priority |
| CTR | How often people click your thumbnail | 4 to 8%, up to 12% for tutorials | Highest |
| Average View Duration | How much of the video people watch | 40%+ good, 50%+ great, under 30% weak | Highest |
| Traffic Source Mix | Where your views come from | More from search and suggested | Medium |
| Subscriber Conversion | New subscribers per video vs. viewers | 0.5 to 2% | Medium |
| Returning Viewers | Share of repeat viewers | 20 to 40% | Medium |
| Total Views / Subscriber Count | Big-picture totals only | Not useful on their own | Low |
| RPM | Real earnings per 1,000 views | Check your Studio Revenue tab | Medium (if monetized) |
This whole check should take under 20 minutes each week. Do it on the same day so it becomes a habit. Look for patterns across videos, not single lucky results. One strong upload proves little on its own. A repeated pattern across three uploads tells you what to do next.
Common Mistakes Pakistani Creators Make Reading Their Analytics
A few habits quietly slow channels down. Most involve reading the wrong numbers first. Fixing these mistakes sharpens every future upload. Many of them come from copying advice built for other markets. Watch for the following patterns in your own review:
1. Misinterpreting Views and Subscriber Counts
Many Pakistani creators track raw views and subscriber totals as their main success metr
- The Mistake: Chasing high view counts or subscriber milestones without checking whether those views convert into watch time or returning viewers.
- How to Fix: Watch CTR and average view duration instead. Both metrics predict future reach better than raw totals ever will.
2. Failing to Analyze Audience Retention
A video’s retention curve tells you more than its view count ever will.
- The Mistake: Publishing a video and never opening the retention graph, especially on videos that underperform.
- How to Fix: Check where viewers drop off. A steep early drop usually points to a fixable intro or pacing issue, not a bad topic.
3. Ignoring Click-Through Rate and Impressions
CTR and impressions decide whether YouTube keeps showing your video to new viewers.
- The Mistake: Focusing only on watch time while ignoring low CTR, which quietly limits how often YouTube surfaces the video.
- How to Fix: Treat CTR below 4 to 5 percent as a thumbnail or title problem first, not a content problem.
4. Misreading Traffic Source Locations
Many Pakistani creators check the Geography tab once, then create broad content hoping to reach a global audience.
- The Mistake: Ignoring the local Pakistani audience already engaging, or targeting a foreign audience without understanding their viewing habits.
- How to Fix: Check whether traffic comes from YouTube Search or Suggested Videos, then tailor titles and descriptions to the top country in your analytics.
5. Evaluating Revenue and RPM Too Early
RPM comparisons across countries create a misleading picture for new creators.
- The Mistake: Comparing RPM to US or UK creators, or judging monetization performance within the first few weeks of a video going live.
- How to Fix: Track RPM against your own channel’s past months. Ad rates differ by country, so cross-market comparisons distort the read.
Conclusion: Focusing on the Numbers That Actually Move a Pakistani Channel Forward
CTR and Average View Duration should drive most of your decisions. Traffic sources and subscriber conversion rate come next in line. Total views, raw subscriber count, and foreign RPM comparisons deserve far less weight. Master those few numbers and YouTube channel growth Pakistan creators chase becomes far more predictable.
Steady weekly review beats occasional panic-checking every single time. That habit is the real value inside YouTube Analytics for Pakistani channels creators often overlook. Reading data well takes time many busy creators simply do not have. If you want that handled for you, Delenzo Studio offers ongoing YouTube channel management. Our team watches the right numbers and turns them into clear upload decisions.
Connect With Delenzo Studio
Ready to elevate your brand? Reach out to our team today and let’s craft designs that inspire and deliver results.
Contact UsFrequently Asked Questions
What YouTube Analytics metrics actually matter for growth?
CTR and Average View Duration matter most for growth. They predict algorithm distribution better than total views or subscribers. Track both first, then check traffic sources and subscriber conversion as secondary signals weekly.
What is a good CTR for a YouTube channel in Pakistan?
A good CTR for Pakistani channels sits between 4 and 8 percent, reaching 12 percent for tutorials. New channels often start lower. Focus on bold, readable thumbnails to steadily improve this number.
Why is my YouTube RPM lower than what I see in international guides?
Pakistani RPM runs lower because advertiser demand and ad rates vary by audience geography. International benchmarks assume Western audiences, so they don’t apply. Compare your RPM to your own past months instead.
Is subscriber count the best way to measure YouTube channel growth?
No, subscriber count is a lagging vanity metric. Subscriber conversion rate, the percentage of viewers who subscribe per video, reveals far more. A healthy target sits between 0.5 and 2 percent of unique viewers.
How do I know if a video’s low performance is a content problem or a production quality problem?
Check the retention curve first. A steep early drop points to a slow intro or weak audio, a production issue. Gradual decline throughout usually signals the content itself needs improvement.